
Electrochemical Impedance Spectroscopy (EIS)
Electrochemical Impedance Spectroscopy (EIS) is an electrochemical technique to measure the impedance of a system in dependence of the AC potentials frequency.
Electrochemical Impedance Spectroscopy: complex and popular
Electrochemical Impedance Spectroscopy (EIS) is one of the most complex techniques in electrochemical research. On this page the basics of EIS are explained, i.e. the excitation and the signal as well as the recorded values. The visualization and analysis of the EIS data is explained in the following chapters.
Electrochemical Impedance Spectroscopy (EIS) gained a lot of attention in the last 10 years. It is for multiple reasons quite popular. One reason is that EIS allows separating the influences of different components that means the contribution of the electron transfer resistance, double layer capacity, etc.
Surface sensitive
Another one is that electrochemical impedance spectroscopy is very surface sensitive, which makes many changes visible that other techniques don’t see, for example changes in polymer layers due to swelling, surface changes due to protein adsorption or penetration of corrosion protection layers.
As a result electrochemical impedance spectroscopy is interesting for analytical electrochemistry, because molecules can be detected without a redox active marker.
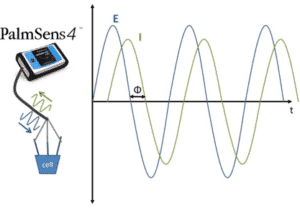
While resistance is the ratio of voltage or potential and current for a DC (direct current) system, the impedance is the ratio of voltage or potential and current for AC (alternating current) systems.
The wave nature makes it necessary to define the impedance with two parameters. One is the total impedance Z and the other one is the phase shift Φ.
Recommended instruments
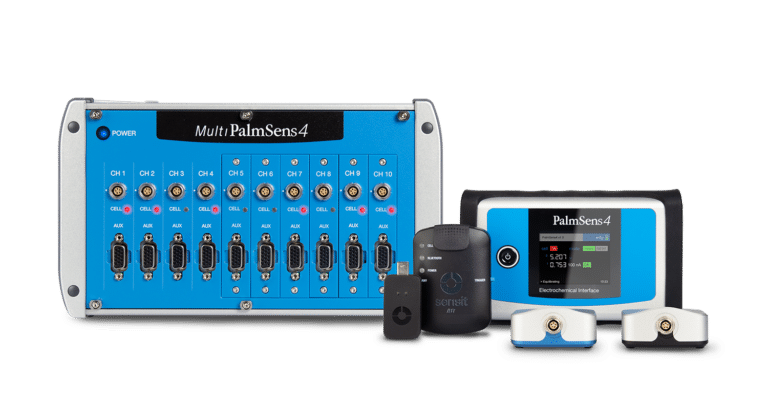
Electrochemical Impedance Spectroscopy can be performed with any of our instruments. However, our flagship instrument is the PalmSens4. An alternative is the MultiPalmSens4.
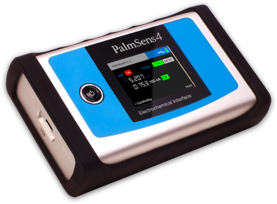
PalmSens4
High-performance EIS in a compact device
- Wide frequency range (10 µHz – 1 MHz)
- Standalone or PC-controlled
- Powerful software included

MultiPalmSens4
Multi-channel EIS measurements for advanced research
- Up to 10 channels in one system
- Independently controlled or synchronized
- Full EIS support (10 µHz – 1 MHz)
What makes a potentiostat capable of EIS
Almost any potentiostat can run an impedance measurement. Whether it can run the one you need is decided by four specifications.
The top of the frequency range determines whether you can separate electrolyte resistance from double-layer capacitance. In a battery or a thin coating those features sit high in the spectrum, and an instrument that stops at 100 kHz will not resolve them.
The bottom of the range is where diffusion and slow corrosion processes live. Every PalmSens instrument reaches 10 µHz, so the low end is not what separates them. The choice is made at the top.
The AC amplitude range decides whether you can stay in the linear regime on a difficult cell. In galvanostatic mode the amplitude is set as a fraction of the selected current range rather than in volts.
Whether the frequency range is a hardware option. On PalmSens4 and MultiPalmSens4 the FRA bandwidth is chosen when the instrument is ordered, and on MultiPalmSens4 it is chosen per channel. That is not a setting you can change afterwards, which makes it worth deciding before the purchase order rather than after.
| Specification | PalmSens4 | Nexus | MultiPalmSens4 | EmStat4X |
|---|---|---|---|---|
| Frequency range | 10 µHz – 100 kHz or 1 MHz | 10 µHz – 1 MHz | 10 µHz – 100 kHz or 1 MHz, per channel | 10 µHz – 200 kHz |
| AC amplitude (potentiostatic) | 1 mV – 0.25 V rms | 1 mV – 0.3 V rms; to 1.4 V rms below 1 kHz | 1 mV – 0.25 V rms | 1 mV – 0.9 V rms |
| Galvanostatic EIS | 10 µHz – 100 kHz, 0.001 – 0.4 × range | 10 µHz – 1 MHz, 0.001 – 0.15 × range rms | 10 µHz – 100 kHz, 0.001 – 0.4 × range | 10 µHz – 100 kHz, to 0.9 × range rms |
| Frequency range is a hardware option | Yes | No, 1 MHz as standard | Yes, chosen per channel | No |
| Channels | 1 | 1, stackable | 4 – 10 | 1 |
Frequency range is only one of the limits an experiment can run into. The wider comparison, including current range and channel count, is set out for the potentiostat for advanced users.
How long a low-frequency measurement takes
The low end of an impedance spectrum is expensive in a way that is easy to underestimate. A single period at 10 µHz lasts just under 28 hours, and most measurements average several periods per point.
That is why a sweep advertised as reaching 10 µHz is rarely run there. In practice people stop at 10 mHz or 1 mHz and accept that the diffusion tail is incomplete.
It also explains why drift matters more at the bottom of the spectrum than anywhere else. Over a measurement that runs for hours the cell is no longer the same system it was at the start, and the low-frequency points quietly describe something that has moved.
If the diffusion region genuinely matters for your work, plan the experiment around the time it takes rather than around the specification.
Periodic waves of current and voltage
If you consider the two periodic waves of current and voltage, the waves have the same frequency, because one wave causes the other. There is a constant time shift between the two waves, which is called the phase shift Φ. Its unit is degrees (°), because usually waves are considered to be vectors in a polar coordinate system or a sine function (see Figure 1.1).
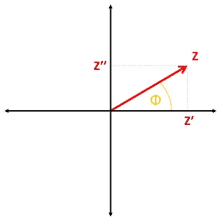
The total impedance is the ratio of the potential’s amplitude and the current’s amplitude. The resulting impedance is a complex number. This number can be expressed in the complex plane in polar coordinates by using Z as the length of the vector and Φ as the angle.
With the common knowledge about calculations for complex numbers the impedance can also be expressed as the real part of the impedance Z’, which is the resistance, and imaginary part Z’’ (see Figure 1.2).
Bode plot and Nyquist plot
The two notations are the origin of the two most popular plots for impedance spectra: the Bode plot and Nyquist plot. More information is given here: Bode and Nyquist Plot.
A potentiostat measures the impedance by applying a potential wave to the working electrode and records the resulting current wave. From these two waves the potentiostat calculates Z, Φ, Z’ and Z’’. The spectrum is made by measuring these parameters for potential waves with different frequencies.
Frequencies
A fixed number per decade is usually chosen, because most plots have a logarithmic axis. This means for example 10 frequencies between 10 000 Hz and 1000 Hz, 10 between 1000 Hz and 100 Hz etc. are chosen, these frequencies are usually equidistant on a logarithmic scale.
PSTrace allows you to choose, if you want to define the total number of points through the whole spectrum or the number of points per decade, whatever option you choose, you can always see a list of the chosen frequencies.
- Electrochemical Impedance Spectroscopy
- Electrochemical Impedance Spectroscopy (EIS) is an electrochemical techniques to measure the impedance of a system in dependence of the AC potentials frequency.
See PalmSens4 with EIS up to 1 MHz Compare instruments with EIS
See also:
Choosing the amplitude
EIS assumes the system responds linearly to the perturbation. Real electrochemical interfaces are not linear, so the assumption only holds while the perturbation stays small.
That is the whole reason amplitudes of 5 to 10 mV rms are so common. It is small enough that the current response stays proportional, and large enough to stay above the noise.
Go larger and the response distorts, which shows up as a Nyquist plot that changes shape depending on how hard you push. Go smaller and the measurement drowns, particularly at the low-frequency end where each point takes minutes.
The practical test costs one extra run. Measure the same spectrum at two amplitudes and overlay them: if they sit on top of each other you were in the linear regime, and if they do not, come down.
Potentiostatic or galvanostatic EIS?
Impedance is a ratio, so in principle it does not matter whether you apply the potential and measure the current or the other way around. In practice the choice matters a great deal.
Potentiostatic EIS applies a small AC potential on top of a DC bias and measures the current that results. This is the default, and for most sensor, corrosion and coating work it is the right one. You know exactly what potential the interface sees, which is usually what you want to control.
Galvanostatic EIS reverses that: a current sine wave goes in and the potential response comes out. This becomes the better choice when the system has a low impedance, as batteries and fuel cells do. A 10 mV perturbation on a cell of a few milliohms draws a current that can run away from you, while a current perturbation stays bounded whatever the impedance turns out to be.
A low-impedance cell will happily turn a small potential into a large current. Controlling the current instead is what keeps the perturbation small.
There is a second reason to reach for galvanostatic mode. A cell that drifts, such as a battery relaxing after a charge step or a corrosion sample that is still settling, moves its own potential while you measure. Holding the current fixed lets the cell find its own potential instead of fighting it.
PalmSens instruments support both modes. On the galvanostatic side the amplitude is set as a fraction of the selected current range rather than in volts, which is worth knowing before you plan a series of measurements.
Frequently Asked Questions
We are often asked these questions about electrochemical impedance spectroscopy.
What is Electrochemical Impedance Spectroscopy (EIS)?
Electrochemical Impedance Spectroscopy (EIS) is an electrochemical technique to measure the impedance of a system in dependence of the AC potentials frequency. It is for multiple reasons quite popular.
One reason is that EIS allows separating the influences of different components that means the contribution of the electron transfer resistance, double layer capacity, etc.
Another one is that electrochemical impedance spectroscopy is very surface sensitive, which makes many changes visible that other techniques don’t see, for example changes in polymer layers due to swelling, surface changes due to protein adsorption or penetration of corrosion protection layers.
As a result electrochemical impedance spectroscopy is interesting for analytical electrochemistry, because molecules can be detected without a redox active marker.
What is Electrochemical Impedance Spectroscopy (EIS) used for?
Electrochemical Impedance Spectroscopy is used to demonstrate the presence of a particular substance in a (usually a) liquid and/or to measure its quantity using electrical waves.
A potentiostat sends these waves to the liquid to be measured and from the reaction that comes back an electrochemical researcher can read the information he needs for this purpose.
One can think of testing/measuring HIV in blood or mercury in groundwater. The advantage of electrochemical impedance spectroscopy is that the testing does not affect the fluid, the testing can be done outside the lab and the testing takes little time.
What is the difference between impedance and resistance?
In electrochemical measurements, resistance refers to how much a system opposes the flow of direct current (DC) — it’s the simple, frequency-independent opposition described by Ohm’s law (R = V/I). By contrast, impedance is the equivalent concept for alternating current (AC) and includes not only resistance but also reactive effects from capacitive and inductive behavior. Impedance is a complex quantity composed of both magnitude and phase, meaning it can vary with the frequency of the applied AC signal.
In electrochemical impedance spectroscopy (EIS), impedance gives us a much richer picture of an electrochemical system than simple resistance — because it captures how the system responds to an AC signal across a range of frequencies, revealing contributions from double-layer capacitance, charge transfer, diffusion, and more.
Why do we use AC instead of DC in EIS?
Electrochemical impedance spectroscopy measures how an electrochemical system responds to an applied electrical signal over a range of frequencies. To achieve this, we use a small AC perturbation — typically a sinusoidal signal — because:
-
AC lets us probe frequency-dependent processes.
Different electrochemical processes (e.g., double-layer charging, charge transfer, mass transport/diffusion) respond differently at different frequencies. -
DC can’t distinguish these processes.
A DC (constant) signal only gives one value of response, whereas AC measurements spanning multiple frequencies capture dynamic behavior.
By applying sinusoidal potentials of different frequencies and analyzing both the amplitude and the phase of the resulting current, we turn what would be a single impedance value into a spectrum that reveals mechanistic information about the system — this is the core idea behind electrochemical impedance spectroscopy.
What is the physical meaning of phase shift in EIS?
When you apply a sinusoidal (AC) potential to an electrochemical cell, the current that flows in response does not always follow the exact same timing as the applied potential. The phase shift is the time delay between the peaks of the voltage and current waves.
-
In a pure resistor, voltage and current are perfectly in phase (no phase shift).
-
In systems with capacitive or kinetic processes, current can lead or lag the voltage.
This phase information is not just noise — it tells us about the energy-storage processes in the electrochemical system. For example:
-
Capacitive behavior (e.g., double-layer at an electrode surface) causes a phase shift of up to –90°.
-
Faradaic or charge transfer processes often show intermediate phase shifts that reveal kinetic and transport characteristics.
In electrochemical impedance spectroscopy, analyzing both the magnitude and the phase of the impedance across frequencies allows us to separate and understand different underlying electrochemical mechanisms.
What does frequency tell us in impedance measurements?
Frequency is one of the most important variables in electrochemical impedance spectroscopy — it essentially determines which processes you are probing in your measurement.
-
High frequencies tend to highlight fast processes such as solution resistance or charging of the electrical double layer.
-
Low frequencies reveal slower processes, including mass transport, diffusion and slow kinetics.
By sweeping the AC signal over a range of frequencies, you create a frequency response of the system. When plotted — in a Bode plot (impedance magnitude and phase vs. frequency) or a Nyquist plot (imaginary vs. real part of impedance) — this data reveals how each electrochemical component behaves over timescales corresponding to different frequency ranges.
Frequency tells you which processes dominate at which timescales, making it possible to distinguish and model them in EIS.
Explore how different frequencies relate to EIS responses in the PalmSens Bode and Nyquist Plot overview.
What is the difference between EIS and regular impedance spectroscopy?
The term impedance spectroscopy refers broadly to measuring the impedance of a system as a function of frequency — this concept is used in physics, materials science, and electrochemistry alike.
Electrochemical impedance spectroscopy (EIS) is a specific application of impedance spectroscopy that targets electrochemical systems such as electrodes in electrolytes, batteries, sensors, and corrosion interfaces. It applies the same fundamental concept (frequency-dependent impedance) but is interpreted within the context of electrochemical processes and reactions.
Put simply:
-
Impedance spectroscopy = general technique measuring frequency-dependent impedance.
-
Electrochemical impedance spectroscopy = the electrochemical version of this technique, using equipment like potentiostats and analyzing electrochemical interfaces.
EIS is impedance spectroscopy specialized for electrochemistry — that’s the practical difference. Dive deeper into PalmSens’s explanation of electrochemical techniques.
What is the difference between potentiostatic and galvanostatic EIS?
Potentiostatic EIS applies an AC potential and measures the current; galvanostatic EIS applies an AC current and measures the potential. Potentiostatic is the default. Galvanostatic is the better choice for low-impedance systems such as batteries and fuel cells, where a small potential perturbation can drive an uncontrolled current.
Can I do EIS with any potentiostat?
Most potentiostats offer some form of impedance measurement, but the usable frequency range, the amplitude range and whether galvanostatic mode is available differ considerably. On several instruments the frequency range is a hardware option chosen at purchase rather than a setting.
What frequency range do I need for EIS?
The low end is set by the slowest process you want to see, such as diffusion or film growth. The high end is set by how well you need to separate electrolyte resistance from double-layer capacitance, which is where battery and coating work pushes towards 1 MHz.
What AC amplitude should I use for EIS?
Between 5 and 10 mV rms suits most systems. Verify it by recording the same spectrum at two amplitudes: if they overlay, the response was linear.