Voltammogram
A voltammogram is a graph that can be drawn after an electrochemical experiment. This graph has a typical, recognizable form in which the electron flow (current: i) is measured in Volt against the potential (E).
Voltammogram
The typical shape of the voltammogram (Figure 1) is due to the way in which an electrochemical experiment is usually set up. There are roughly two groups of measurements that are plotted as voltammograms: pulsed techniques and linear sweeps. The focus of this topic is linear sweep.
Phases in a voltammogram
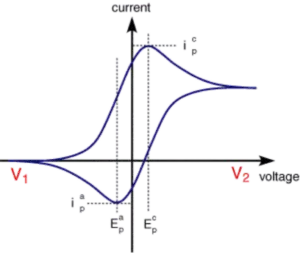
In order to investigate the presence of a particular substance in a liquid, a potential is applied to an electrode in the liquid by means of a potentiostat. This potential is increased linearly by a fixed increase per period of time. The potential of the electrode will cause the substance to react. The initial cathodic (negative), where no reaction took place, turns into a more anodic (positive) potential. The electrode starts to draw electrons from the substance in the liquid towards itself. The curve now shows an exponentially upward trend, i.e. with increasing potential the current increases.
After reaching the so-called redox potential, the initial exponential rise of the curve levels off. The cause being the decreasing amount of substance in front of the electrode, which also results in a lack of electrons, until eventually no electrons are left to draw close. The curve is at its highest point.
The potential is still being increased towards anodic (positive) potentials. Still the current is decreasing, because there is less and less substance left to collect. Due to diffusion substance is transported towards the electrode. All substance that reaches the electrode is immediately converted. A further increase of potential doesn’t lead to an increase of current. The current is limited by the diffusion of new substance towards the electrode.
There is no reason to increase the potential any further. In case of Cyclic Voltammetry the potential descend linearly again. This drop in potential causes the lower curve, that shows exactly the same gradient as the upper curve of the voltammogram, but then reversed. The substance, which was converted during the anodic increase will now be reduced (receiving electrons) again.
Voltammogram equipment
Voltammograms are the results of electrochemical experiments that can be performed with a potentiostat. Palmsens BV developed a broad range of potentiostats that can be used in the field of electrochemistry. You can choose from:
- EmStat: Small research grade economical potentiostat
- Potentiostat Module: The EmStat potentiostat is also available for OEM purposes.
- Palmsens4: The PalmSens4 is our flagship instrument. This potentiostat is also a galvanostat and EIS analyzer.
- Sensit Smart: The Sensit Smart is the world smallest ready-to-go potentiostat available on the market.
Analysis software
In order to analyse the measured voltammogram you need dedicated software. All PalmSens potentiostats are delivered with a full version of the software with integrated analysis tools. Our single channel instruments can be controlled via a PC (PSTrace) or Smartphone/Tablet (PStouch). Our multichannel instruments can be controlled via MultiTrace.
- Voltammogram
- A graph that can be drawn after an electrochemical experiment. This graph has a typical, recognizable form in which the electron flow (current: I) is measured in Ampere against the potential (E) in Volt.