Stern-Geary equation
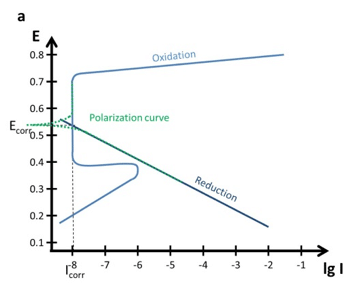
When plotting the current versus the potential the polarization curve is approximately linear close to Ecorr (±10 mV). The slope of a line in a voltammogram (current versus potential plot) is a resistance. The slope close to Ecorr is called the polarization resistance Rpol. The polarization resistance is of interest for corrosion researchers, because it is inversely proportional to the corrosion current, assuming that the Tafel slopes are constants. This is described by the Stern-Geary equation (equation 5.2).

The corrosion rate in mm/year can be calculated according to the standard practice described in the ASTM Standard G 102. To calculate an estimation of corrosion the corrosion current as well as the following material parameters are needed: equivalent weight EW in g/mol, the density ρ in g/cm3, and the sample area A in cm2 of the study sample. Combined with a constant (K) defined by the ASTM (3272 mm/(A*cm*year*mol)) this information is used to determine the corrosion rate in mm/year according to equation 5.3.
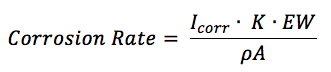
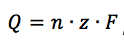
K is the summary of a few constants. Equation 5.3 is derived from Faraday’s law (equation 3.1) by introducing the equivalent weight EW. For an atomic species (so pure metals) the equivalent weight EW is the atomic weight AW divided by the number of electrons needed for conversion z (equation 5.4). AW corresponds here to the more commonly used, molecular weight M.
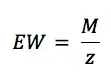
The equivalent weight EW of alloys is more complex to determine. If an alloy is corroding homogeneously, the EW is the weighted averaged molecular M of the alloy components. The weighting factor is the mole fraction of each component. Many alloys do not dissolve homogeneously. If you want to calculate a corrosion rate for them anyway, you need to measure in which mole fraction the alloy dissolves, for example by investigating the solution in contact with the alloy before and after a corrosion event.
Articles
Polarization Curves: setup, recording, processing and features
In this extensive section Polarization Curves are discussed. How to setup your equipment, the choice of parameters as well as the data processing is discussed. This will enable you to record a polarization curve and extract the corrosion rate from it by using PSTrace 5. Furthermore, the polarization curves and Evan’s diagrams for passivation films (thick and thin) are discussed. This section closes with a brief description of crevice and pitting corrosion.