Evan's Diagram
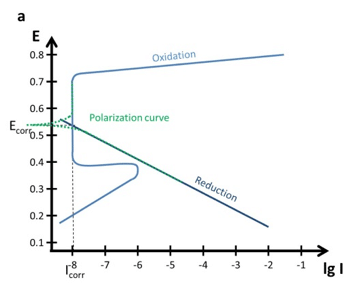
The Evan’s diagram shows the relationship of current and potential for the oxidation and the reduction reaction. These are usually plotted as potential versus the logarithm of the current (E-lg I) curves.

If these two reactions are responsible for the corrosion and no currents flow from or into the systems, all the electrons released by the oxidation must be accepted by the reduction. So the two reactions can only corrode at the potential where both reactions currents are the same. This means the curves of the two reactions should intersect in the Evan’s Diagram.
This means, if the intersection in the Evan’s Diagram of the two reactions is know, the corrosion potential and corrosion current are known.
The popular Tafel Analysis is based on these theories.
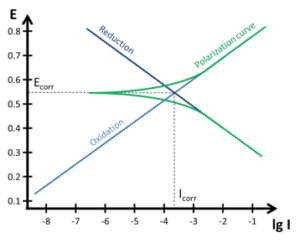
with Evan’s diagram (blue)
Articles

Detection of Multiple Heavy Metals 2/5 – Why Care about Heavy Metals?
This chapter is the first in the series ‘Detection of Multiple Heavy Metals by Stripping Voltammetry’. This chapter highlights the relevance of heavy metal detection.

Tafel Plot and Evans Diagram
To understand the foundation of corrosion current measurements the Tafel plot and the Evan’s diagram are explained. The connection between a polarization curve and the Evan’s diagram is explained and how to extract the corrosion current from a polarization curve.
Polarization Curves: setup, recording, processing and features
In this extensive section Polarization Curves are discussed. How to setup your equipment, the choice of parameters as well as the data processing is discussed. This will enable you to record a polarization curve and extract the corrosion rate from it by using PSTrace 5. Furthermore, the polarization curves and Evan’s diagrams for passivation films (thick and thin) are discussed. This section closes with a brief description of crevice and pitting corrosion.