Cyclic Voltammetry 3/4- What Information Can a CV Provide?
This chapter is part of the series ‘Cyclic Voltammetry – the Most Used Technique’. Here we explain what information can be read from a cyclic voltammogram (CV) and how.
Cyclic Voltammogram
Quantitative analysis, i.e. determining how much of the species is in the solution, is usually done by observing the change of the peak current. The peak current is proportional to the concentration of the species inside (see equation 2.1). This makes it easy to perform a series of measurements to create a calibration curve or perform a standard addition (see for example this Chapter).

Further information can be acquired from the shape of the CV. A reversible system, which is a system that allows the oxidation after reduction or the other way around, always shows a pair of peaks: one peak for the reduction at the cathodic sweep and one peak for the oxidation at the anodic sweep. If one of these peaks is missing, the system is not reversible under the given conditions.
There are two different reasons for an irreversible system. The species is simply not reversible, because the back reaction is blocked kinetically or thermodynamically or the converted species has a follow-up reaction that consumes it. This can be due to another present reagent or due to decay.
In a CV the time is a controlled parameter via the scan rate v. This allows investigating the cause of this behavior. If the scan rate is increased and the missing peak appears at a certain velocity, the system was irreversible due to a follow-up reaction. As soon as the scan rate is so fast that the back reaction is initiated before the reaction usually consuming the converted species starts, the peak of the back reaction gets visible. So the back reaction is possible and the peak appears. If a back reaction is just very slow, reducing the scan rate v might lead to the appearance of a peak.
Limitations on the scan rate
Unfortunately, an increase in the scan rate cannot be done unlimitedly. An obvious reason is the device. Each potentiostat, AD/DA converter, etc. has a limited amount of values it can process per second, the EmStat3 for example has a maximum of 1000 points per second. This could be compensated by increasing the distance between each point of the measurement. Usually, the potentiostat averages some values before returning them as one point. The higher the scan rate, the less time is used per step, the fewer points can be averaged. As a result random noise is not averaged out.
Another limitation is the rise time that is the minimum time needed for the potentiostat to adjust the potential is not infinitely small. The EmStat can still manage a scan rate of 5 V/s with a step potential of 5 mV.
Another limit is set by the capacitive current. As seen from equation 4.13 (p. 37) the capacitive current will grow linear with the scan rate. The Faraday current will also increase; since the same species is converted in a shorter time the current is higher. The diffusion layer is also thinner and the concentration gradient is steeper, thus the flux towards the electrode is higher if the scan rate is increased. The correlation between the peak current Ip of a free diffusing species and the scan rate is:

This means that the capacitive current increases faster than the peak current with an increasing scan rate. The capacitive current will dominate the CV above a certain scan rate and the shape and peaks caused by the faraday current cannot be identified anymore. If experiments demand very high scan rates, ultramicroelectrodes are often used. These very small electrodes have very small capacities and thus high scan rates can be used.
Peak shape and peak current
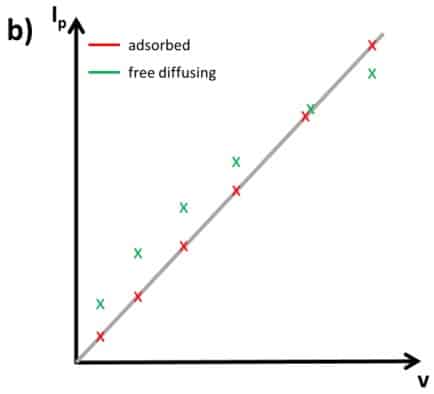
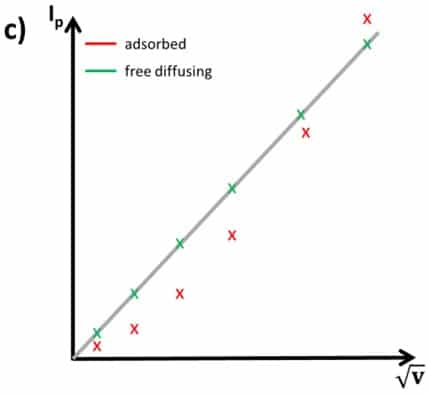
Equation 2.2 can provide important information for an electrochemical system indirectly. This equation is only valid for free diffusing species. The peak shape and peak current for adsorbed species are different. Due to the fact that there is no diffusion from the bulk to the electrode of the species but depletion of the species at the surface, a symmetrical peak appears in the voltammogram (see Figure 2.1a). Furthermore, the peak current of an adsorbed species Ip(ads) shows the following behavior:

A series of measurements using different scan rates and plotting the measured peak currents versus v and v½ will show if the active species is surface-bound or free diffusing. If the plot versus v½ is linear, the peak belongs to a free diffusing species and if the plot versus v is linear, the species is adsorbed (see Figure 2.1b and c). This is useful, because most systems have some background currents that will make it difficult to recognize if a peak is symmetrical or not.

Peak shapes can sometimes give information about surface and species surroundings. A completely homogeneous surface, for example the surface of a perfect single crystal, and a completely homogeneous species, for example a monolayer of ferrocene, should deliver a very sharp peak. An experienced electrochemist can actually read a complete CV of a well-known system like others can read an infrared spectrum.
Peak potential
Another parameter that delivers information about the system is the peak potential. A CV allows the fast determination of the redox species’ formal potential, although sometimes only approximately. Assuming that your reaction is controlled by diffusion and potential only and there is no kinetic inhibition, the reaction happens as soon as the potential for an oxidation or reduction is reached. The reactions would be time-independent and an increasing scan rate would have no effect on the peak potential.
The peak current would increase according to equation 2.2 or 2.3 due to the fact that current is passed charge per time. If the reduced and the oxidized species have the same diffusion coefficient in the used solution the formal potential should be exactly between the two peak potentials of reduction and oxidation as equation 2.4 describes.

If the diffusion coefficients are different, the formal potential E0’is still between Ep,a and Ep,c, but not exactly in the middle. The described system is reversible in a classic way. The electrochemical reaction is happening so fast that in the time of the experiment the kinetics will never limit the reaction. In an ideal situation the minimum peak separation, so the difference between Ep,a and Ep,c is:

As before, z is the number of electrons transferred during the reaction. If there is a kinetic inhibition, the peak separation ∆Ep can be larger and will increase with increasing v. The reason is that a kinetic inhibition means a reaction needs more time to happen. If the amount of time is similar to the time it takes to perform a scan, the kinetic inhibition can influence the measurement.
When the potential for the reaction to happen is reached, the reaction starts slowly (due to the kinetic inhibition) but the potential is swept with a constant scan rate. As a result a slow reaction seems to happen at higher potentials. Imagine two people standing in front of a moving belt. On the moving belt there are yellow balls and a row of red balls behind the yellow ones. The first person has super-fast reflexes and you tell that person to grab the first red ball right in front of him/her. The belt starts moving and as soon as the first red ball reaches the person he or she grabs the ball. You increase the speed of the belt several times, but due to the fast reflexes the first red ball is always grabbed. The second person is slower and has the same task. He or she will take a second to realize that there is a red ball. The belt starts moving and this person will grab the second red ball, because he or she was too slow for the first one. If the speed of the belt is increased, the person will grab the third, sixth or twentieth red ball. Maybe you will have run out of balls before the second person was able to grab one. In the same way a kinetic inhibition leads to a peak separation that depends upon the scan rate. A system showing this behavior is considered quasi-reversible.
An irreversible system has, as mentioned before, either an anodic or cathodic peak. Examples of this are catalytic processes, which will be explained in the next chapter.