
MethodSCRIPT: Tips & Tricks
These Tips & Tricks will guide you to create your first MethodSCRIPT, debug the script, solve any errors and visualize the results. At the end, you will find example scripts. Alternatively, watch the MethodSCRIPT webinar recording to get introduced by our MethodSCRIPT expert.
MethodSCRIPT is the language our latest generation of potentiostats speaks. It allows you to communicate directly with the potentiostat (module) from any operating system or microcontroller. Supported devices include EmStat4S, EmStat4M, MultiEmStat4, EmStat Pico, Sensit Smart and the Sensit BT.
Get started with your first MethodSCRIPT Watch MethodSCRIPT webinarEdit your first script in PSTrace
The software PSTrace controls all PalmSens instruments. Now lets connect an instrument that supports MethodSCRIPT to your computer, and start PSTrace.
- Connect your instrument in PSTrace
- Select a technique and set the parameters. For example LSV from -0.5 V to 0.5V.
- Click “Show MethodSCRIPT” on the bottom
- Edit a setting, for example lets double the scan rate from 0.1 V/s to 0.2 V/s.
- Copy the script to clipboard.
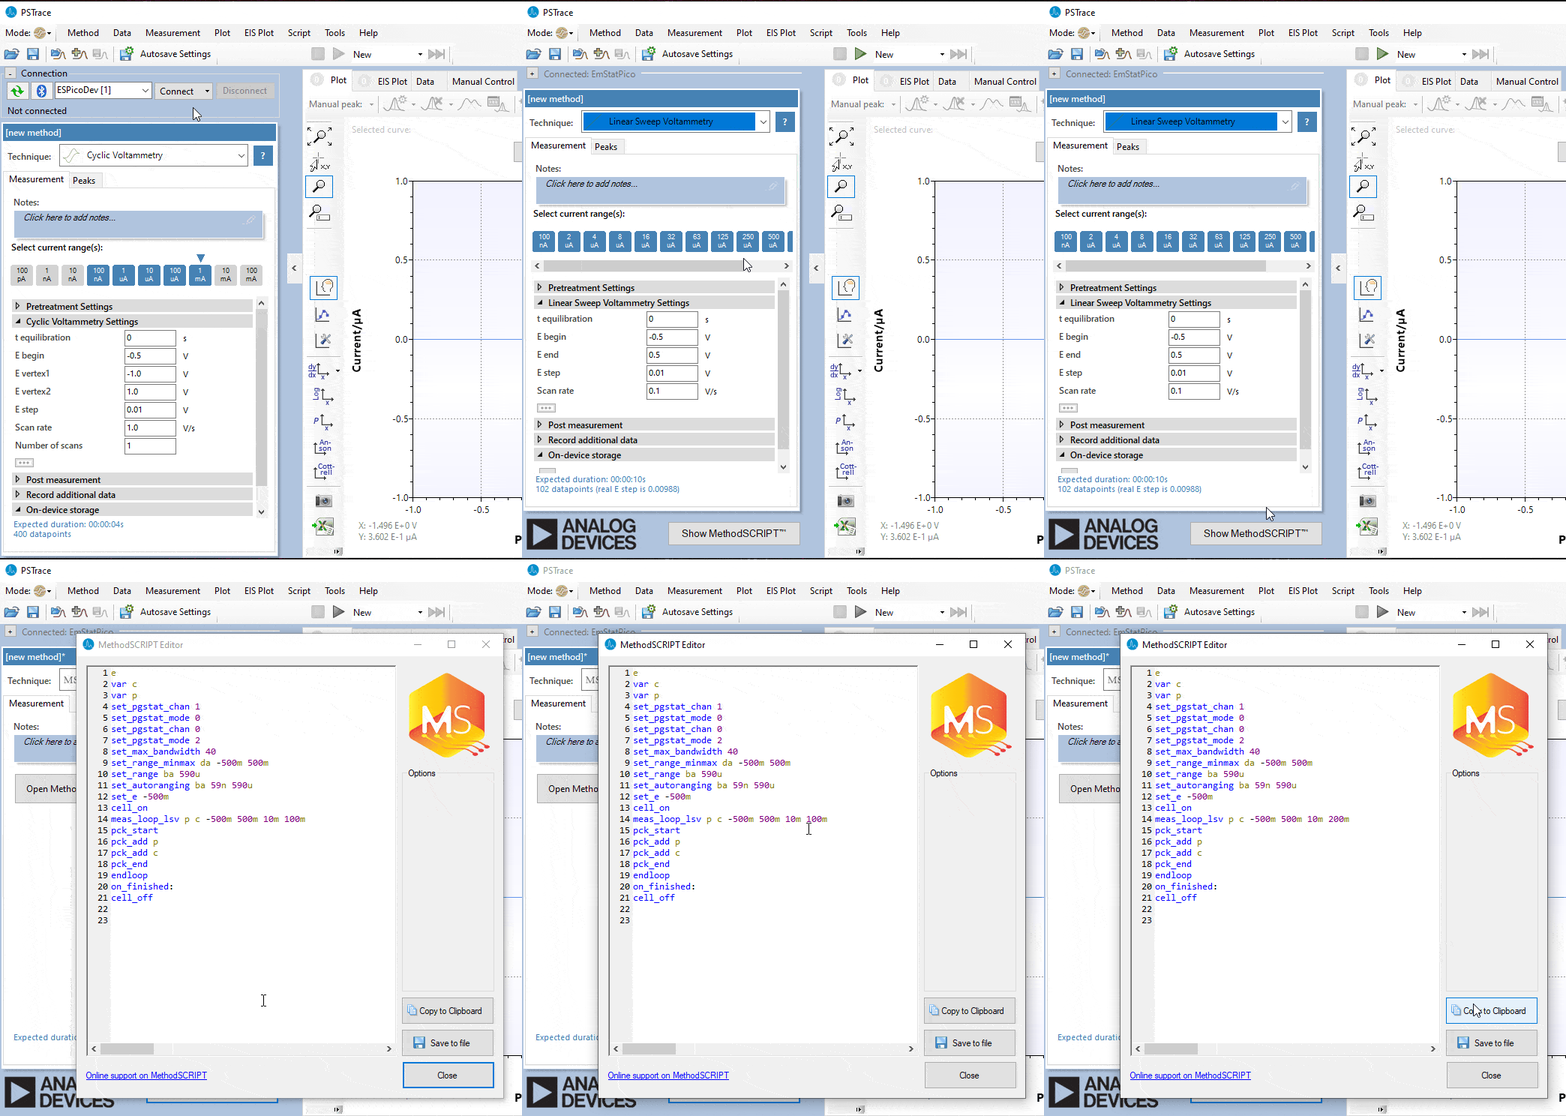
The resulting code will look like this:
e
var c
var p
set_pgstat_chan 1
set_pgstat_mode 0
set_pgstat_chan 0
set_pgstat_mode 2
set_max_bandwidth 40
set_range_minmax da -500m 500m
set_range ba 590u
set_autoranging ba 59n 590u
set_e -500m
cell_on
meas_loop_lsv p c -500m 500m 10m 100m
pck_start
pck_add p
pck_add c
pck_end
endloop
on_finished:
cell_off
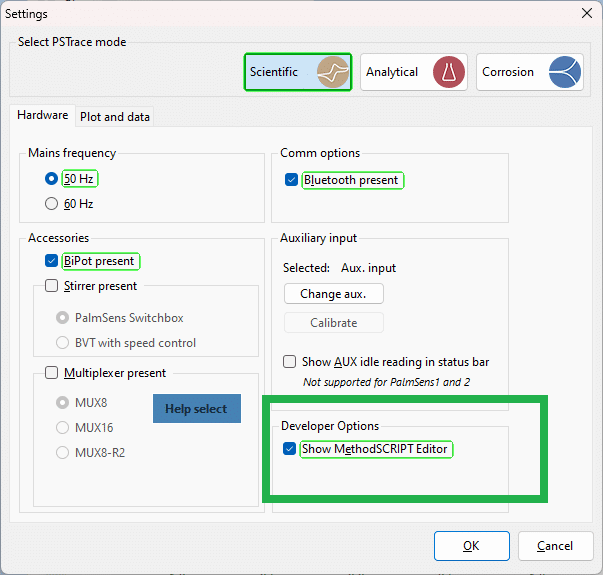
If you can’t see Show MethodSCRIPT button, please enable it by going to the tools –> general settings –> Show MethodSCRIPT editor as shown in the image below.
Create MethodSCRIPTs using Drag 'n Drop
With an intuitive drag-and-drop interface, you can build complete methods by selecting commands, arranging them in the correct order, and instantly seeing the structure of your script. This visual workflow speeds up method development, reduces errors, and helps you get from idea to measurement faster, without needing to manually write the code.
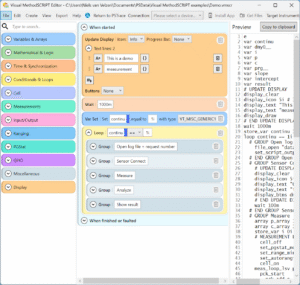
The Visual MethodSCRIPT Editor is in PSTrace 5.13 and later.
Download PSTraceEdit your code using Notepad++
You can use any text editor to change the MethodSCRIPT code. If you prefer Notepad++, you can get correct syntax highlighting by using the MethodSCRIPT XML file.
To get highlighting for MethodSCRIPT files ending with .mscr in Notepad++, please follow these steps:
- Download and unzip the MethodSCRIPT XML file.
- In Notepad++, select Language, User defined language, Define your language, import.
- Select the MethodSCRIPT_vx.x.xml file.
- Restart Notepad++
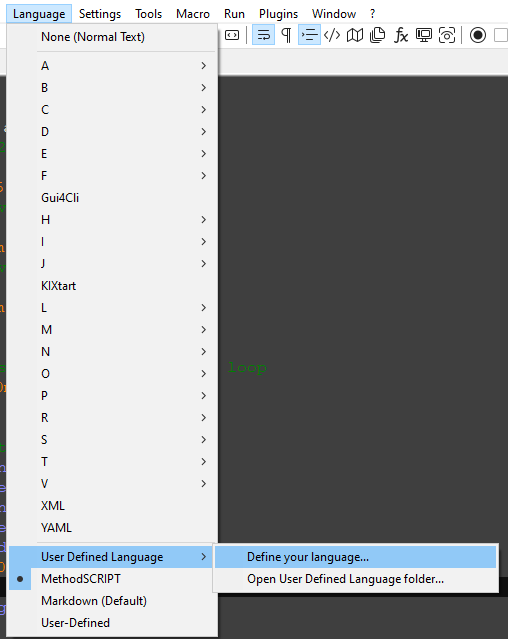
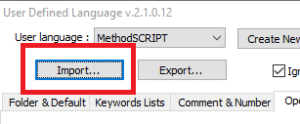
Every .mscr file you open, will automatically load with the correct syntax highlighting.
Download MethodSCRIPT XML file for Notepad++Edit your script using Visual Studio Code
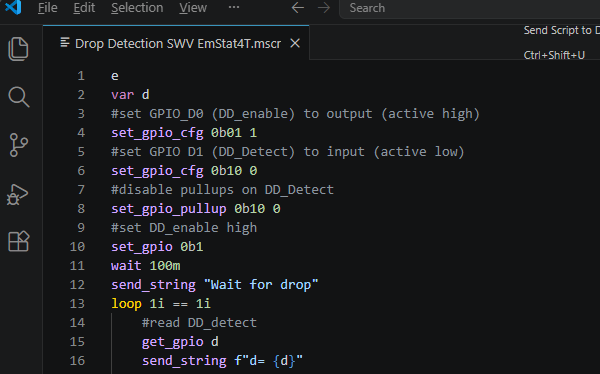
Alternatively, you can edit your script with Visual Studio Code. You can get syntax highlighting, IntelliSense, validation, and code formatting for MethodSCRIPT files using this MethodSCRIPT plugin.
Learn the MethodSCRIPT commands
The script consists of a series of pre-defined commands. Each command starts with the command string, followed by a pre-defined number of arguments. Arguments are separated by a ‘ ‘ (space) character. Each command is terminated by a ‘n’ (newline) character. The ‘n’ is omitted in most examples. Each line is limited to a maximum of 128 characters. Comments can be added by having the first non-whitespace character on the line be ‘#’.
To send a script to the device, first send “en”. This sets the device into MethodSCRIPT mode. To terminate the script, add a line containing only a ‘n’. The following examples send hello world.
e
#This is a comment
send_string "hello world"
The response to this script will be:
en ← Ack of the execute script cmd ‘e’
Thello worldn ← Reply of the “send_string “hello world”” cmd
n ← End of script
For all commands, please check the MethodSCRIPT documentation.
Download the MethodSCRIPT documentationWrite and debug your script with online editor
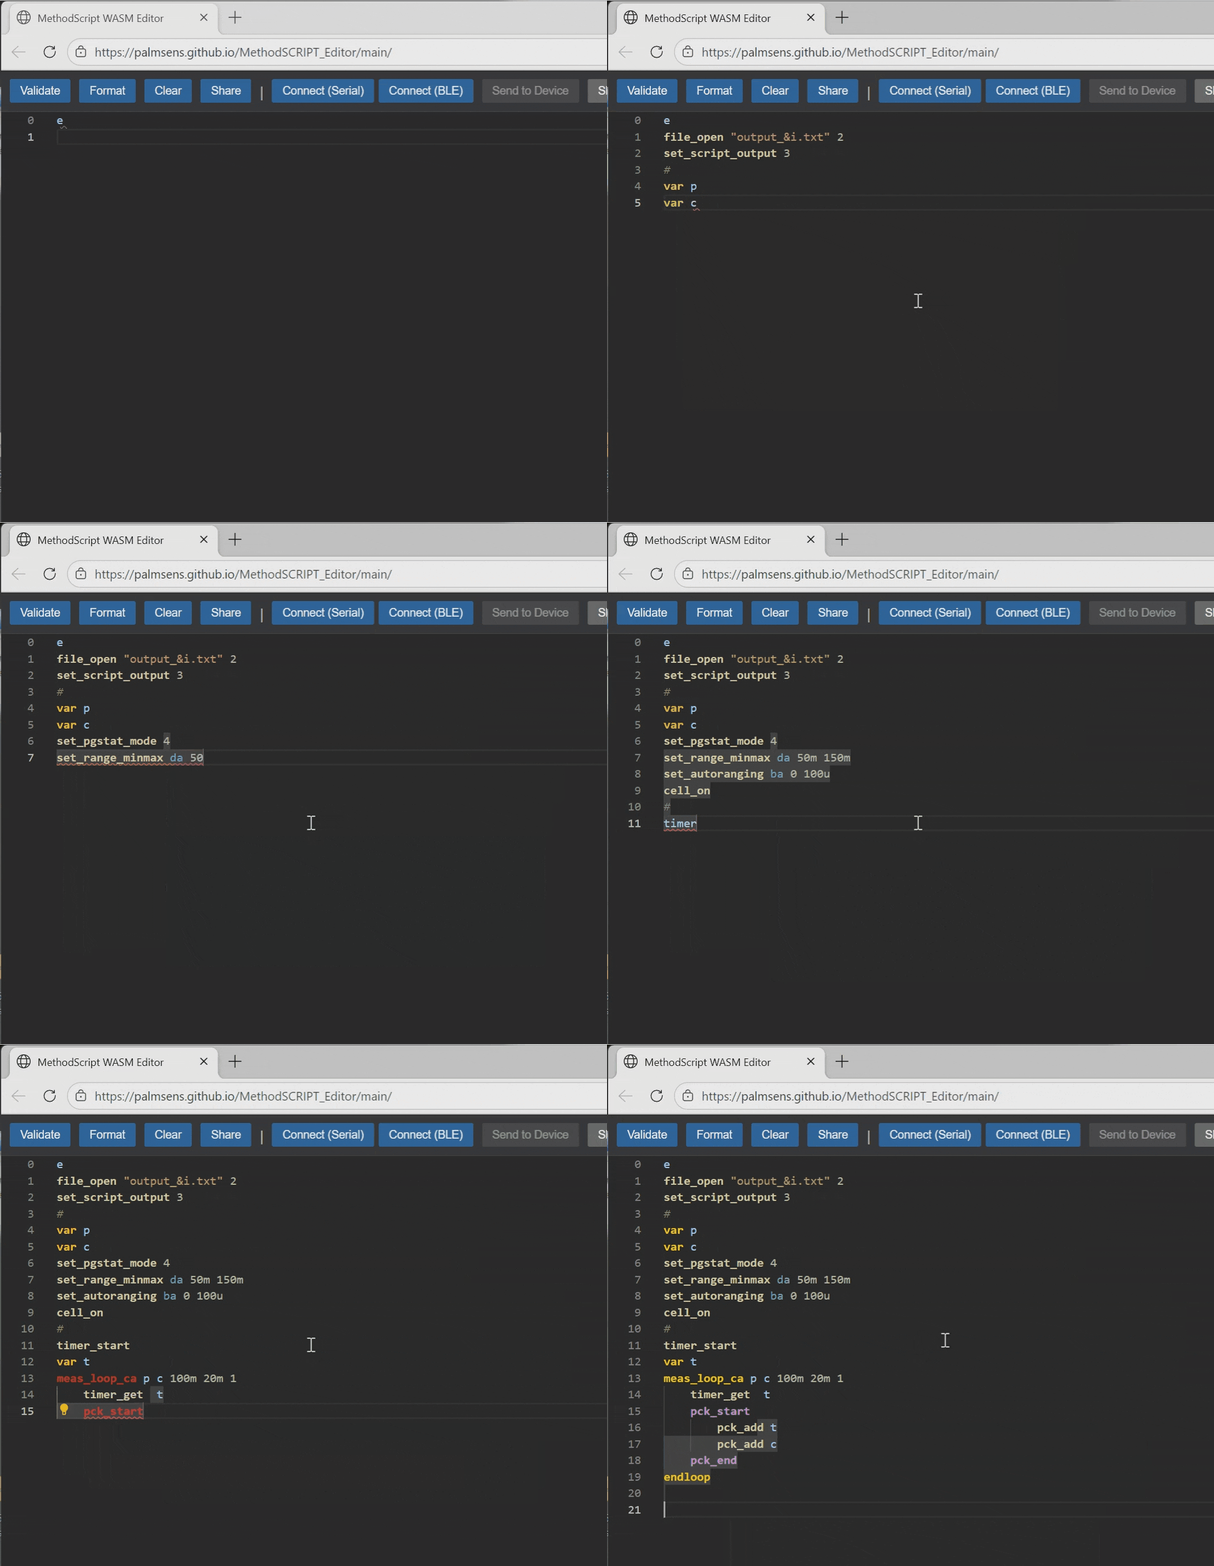
Our online MethodSCRIPT Editor lets you quickly create and edit MethodSCRIPT directly in your browser—no installation required. Run the script directly from your browser, or copy it into the PSTrace MethodSCRIPT Editor. This will give you feedback if the MethodSCRIPT runs correctly, or if it contains errors.
Debug your script with Tera Term
Alternatively for the online editor, you can debug using TeraTerm. When debugging your script, you would like to get immediate feedback: on which line is there an error? The PalmSens instruments that support MethodSCRIPT, can communicate via a serial connection. Tera Term is an open-source and free terminal emulator program. It is often used for serial communication. Via this serial communication, you can send your MethodSCRIPT commands and see the response of the MethodSCRIPT interpreter.
To setup TeraTerm:
- Download TeraTerm
- Setup the terminal to receive and transmit LF: line feed.
- Enable local echo
- Select the Consolas font, regular style, size 10
- Connect your instrument
- As a serial port setup, select a COM port with FTDI in the device instance ID (in case of EmStat Pico) or one that shows EmStat4 (for the EmStat4 LR or HR) in the device friendly name.
- Choose 230400 bit/s as speed for the EmStat Pico based potentiostats, and 921600 bit/s for the EmStat4 based potentiostats.
- Save the setup
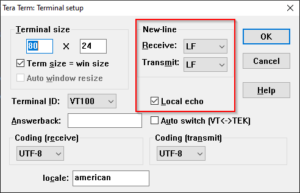
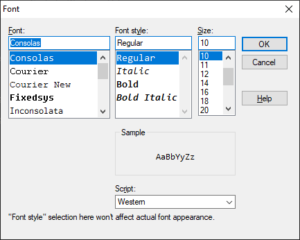
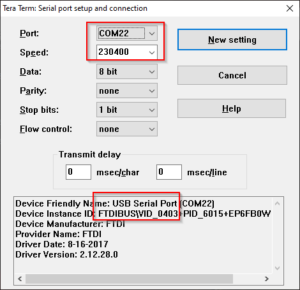
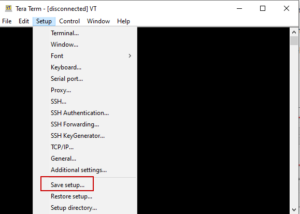
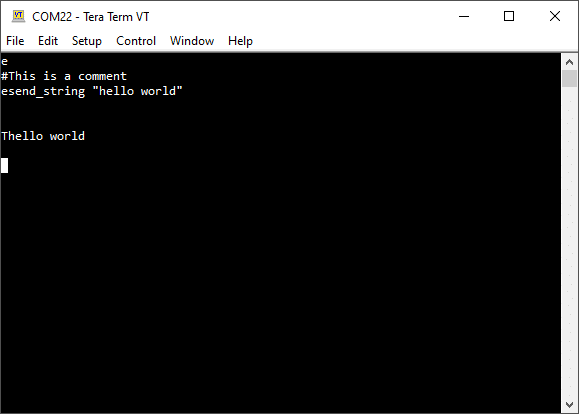
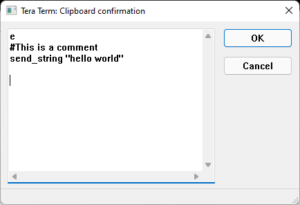
To enter scripts via Tera Term, please paste scripts from the clipboard by using your right mouse button. Manually typing your commands is only doable for short commands. Typing long commands or even scripts will trigger a timeout error 0009. This is an example of pasting the hello world script from the clipboard in TeraTerm. Note the two new lines after “hello world”, for which you can press the enter key twice:
Error handling
Errors can occur that prevent the execution of the MethodSCRIPT. These errors can occur either during the parsing of the script or during the execution of the script (runtime).
Error format
- XXXX = The error code, see table below, where:
- L = Line number, starting at 1
- C = Line character number, starting at 1 (only visible during parsing)
#Error during parsing
!XXXX: Line L, Col Cn
#Error during runtime
!XXXX: Line Ln
Comment lines only count during parsing
The reported line number for runtime errors does not count comment lines. For parsing errors, the comment lines do count.
Solving the error
If you encounter an error, look up the description of the error via this Error Codes table. The description of the error combined with the line number, helps you to find the incorrect command. The MethodSCRIPT documentation will guide with examples of how to use each command.
Download the MethodSCRIPT documentation Lookup Error CodeVisualize the results in PSTrace
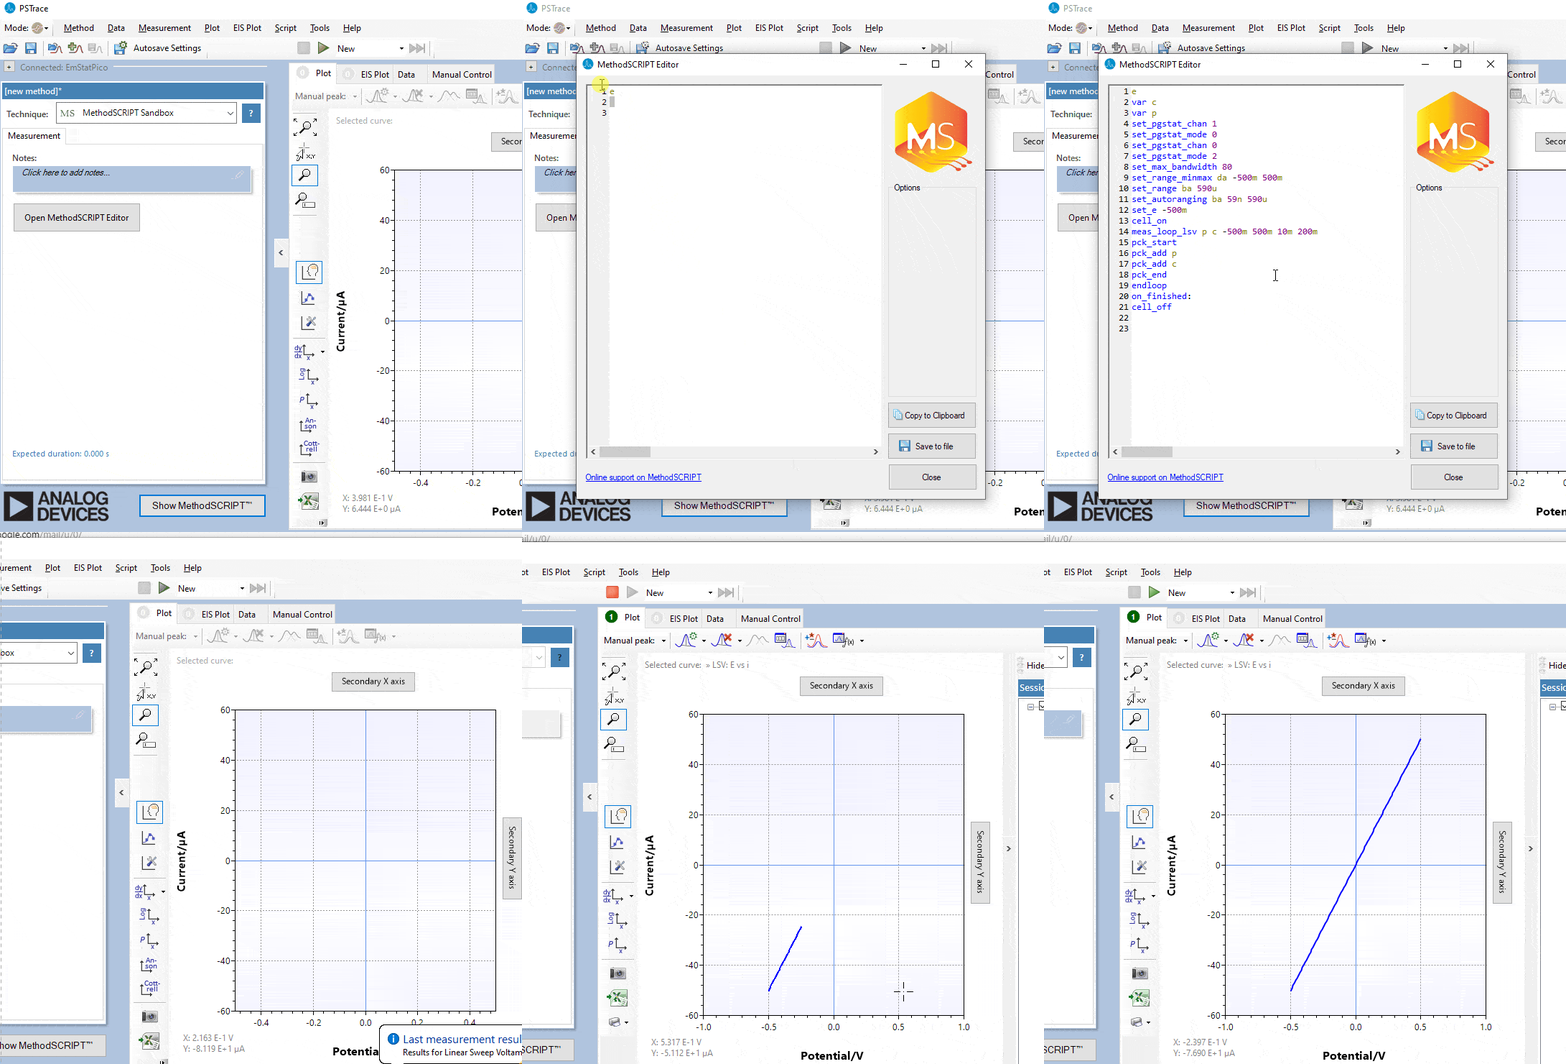
PSTrace can visualize currents and voltages. Each package of data PSTrace receives, can consist of time, voltage and a current. If you have verified in TeraTerm that your script is free of errors and sends back data packages, it is time to copy the MethodSCRIPT into the PSTrace editor.
SWV Example script
This script will perform an SWV measurement from -0.5 V to 0.5 V.
e
var c
var p
var f
var g
set_pgstat_chan 0
set_pgstat_mode 2
# Set maximum required bandwidth based on frequency * 4,
# however since SWV measures 2 datapoints, we have to multiply the
# bandwidth by 2 as well
set_max_bandwidth 80
# Set potential window.
# The max expected potential for SWV is EEnd + EAmp * 2 – EStep.
# This measurement would also work without this command since it
# stays within the default potential window of -1.1 V to 1.1V
set_pot_range -500m 690m
# Set current range for a maximum expected current of 2 uA
set_cr 2u
# Disable autoranging
set_autoranging 2u 2u
# Turn cell on for measurement
cell_on
# Perform SWV
meas_loop_swv p c f g -500m 500m 10m 100m 10
   # Send package with set potential,
   # ”forward current – reverse current”,
   # ”forward current”
   # ”reverse current”
   pck_start
   pck_add p
   pck_add c
   pck_add f
   pck_add g
   pck_end
endloop
# Turn off cell when done or aborted
on_finished:
cell_off
View more examples on GitHub