Tafel plot
As usual, it would be great if we can predict the corrosion current or corrosion potential. Julius Tafel studied the Hydrogen Evolution Reaction (HER) in the early 1900s. HER is a common reaction in corrosion because all water contains protons. He found that there is an exponential relationship between the applied current at a platinum surface and the potential.
This is also true the other way around (applied potential and measured current). A convenient way of plotting this relationship was to plot the potential versus the logarithm of the current, lg I, because using the logarithm leads to a linear plot.
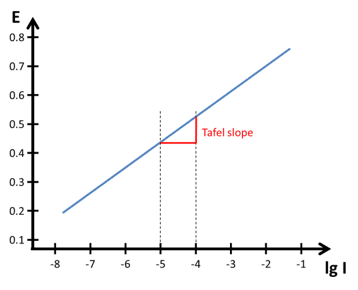
In Figure 4.1 the slope of the line is called the Tafel slope. It is usually expressed in the units mV/decade. This approach is the ideal case. For many reasons real reactions often deviate from this behavior. Very common reasons are passivation and diffusion limitation. The influence of passivation is discussed in chapter Features of Polarization Curves. For more information on the Tafel plot, see chapter Tafel Plot and Evans Diagram.
Articles
Tafel Plot and Evans Diagram
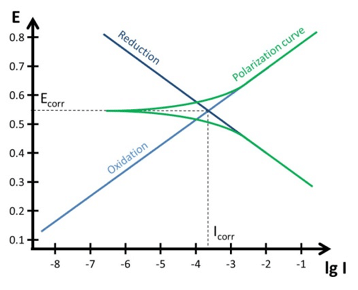
To understand the foundation of corrosion current measurements the Tafel plot and the Evan’s diagram are explained. The connection between a polarization curve and the Evan’s diagram is explained and how to extract the corrosion current from a polarization curve.
