Corrosion concepts

Introduction to the Corrosion Research Knowledge Base
This knowledgebase contains all you need to understand potentiostats, electrodes and how to use them to perform for example coating research or analyze paint. It will give an intro...

List of symbols for corrosion research
Here you will find all the symbols used by us in this knowledge base. Please note that other publications might use different symbols for the same parameters.
Constant Potential vs OCP or vs Reference Electrode
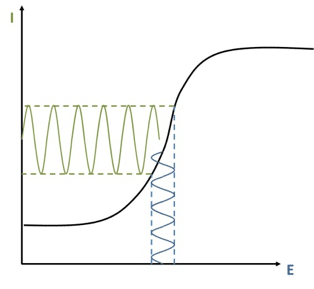
In this section the reasons for choosing a certain DC potential is explained. The advantages of using Ecorr as a reference point will be presented as well as how to choose in PSTrace to use potentials versus the reference electrode or versus Ecorr.

How to fit easily
In this section some guide lines to find good starting values for fitting are given.
Equivalent circuit fitting for corrosion measurements
In this section of the handbook the Warburg Impedance and the Constant Phase Element (CPE) are introduced, which represent electrochemical effects with no corresponding real electronic components. Furthermore, some equivalent circuits for typical corrosion systems are presented.
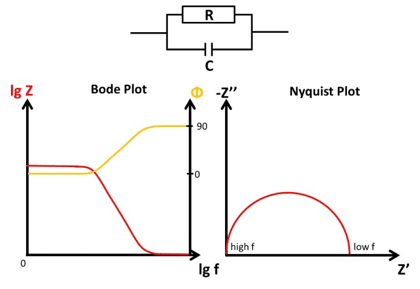
Bode and Nyquist Plot
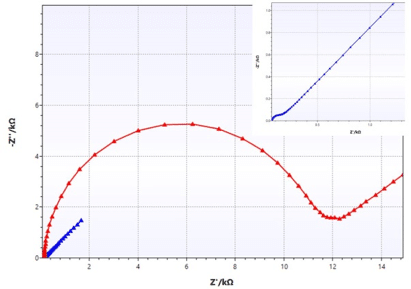
In this chapter the two main ways of visualizing Electrochemical Impedance Spectra (EIS), the Nyquist and Bode plot, are presented and it is explained how different EIS of easy electronic circuits will be plotted in the Bode and Nyquist plot. This demonstrates the advantages and disadvantages of the two plots as well as serving as a foundation to understand the analysis of EIS by utilizing equivalent circuits.
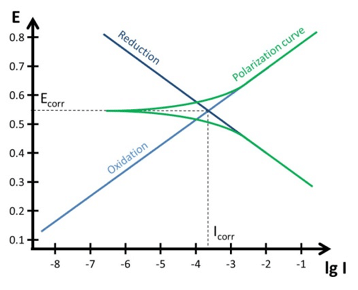
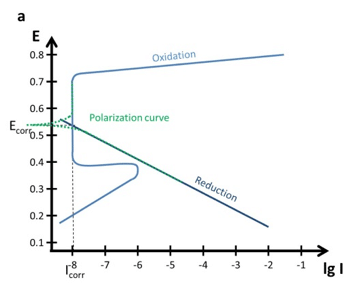
Tafel Plot and Evans Diagram
To understand the foundation of corrosion current measurements the Tafel plot and the Evan’s diagram are explained. The connection between a polarization curve and the Evan’s diagram is explained and how to extract the corrosion current from a polarization curve.
Corrosion current
In this article the corrosion current, a fundamental parameter in corrosion research, is introduced.
Corrosion Potential
In this chapter the Open Circuit Potential (OCP) and the Corrosion Potential are introduced. The principles of reference electrodes as well as the 0 V by convention potential of the standard hydrogen electrode (SHE) are explained.
Polarization Curves: setup, recording, processing and features
In this extensive section Polarization Curves are discussed. How to setup your equipment, the choice of parameters as well as the data processing is discussed. This will enable you to record a polarization curve and extract the corrosion rate from it by using PSTrace 5. Furthermore, the polarization curves and Evan’s diagrams for passivation films (thick and thin) are discussed. This section closes with a brief description of crevice and pitting corrosion.